
Dragonfly Doji Candlestick: How to use in trading
What Is a Dragonfly Doji Candlestick?
A Dragonfly Doji is a type of candlestick pattern that can signal a potential reversal in price to the downside or upside, depending on past price action. It's formed when the asset's high, open, and close prices are the same.
The long lower shadow suggests that there was aggressive selling during the period of the candle, but since the price closed near the open it shows that buyers were able to absorb the selling and push the price back up.

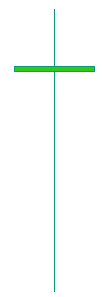
Dragonfly Doji
Important point you should note ;
A dragonfly doji can occur after a price rise or a price decline.
The open, high, and close prices match each other, and the low of the period is significantly lower than the former three. This creates a "T" shape.
The appearance of a dragonfly doji after a price advance warns of a potential price decline. A move lower on the next candle provides confirmation.
A dragonfly doji after a price decline warns the price may rise. If the next candle rises that provides confirmation.
Candlestick traders typically wait for the confirmation candle before acting on the dragonfly doji.
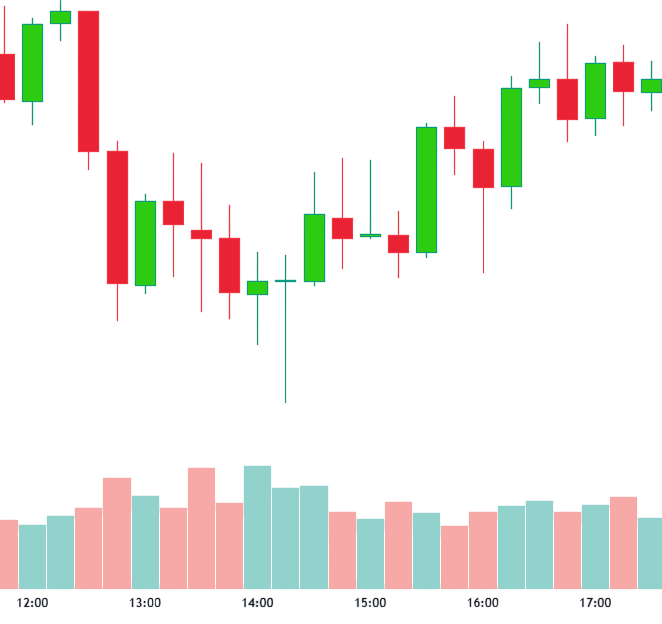
volume bar of dragonfly doji should be bigger then previous volume bar.
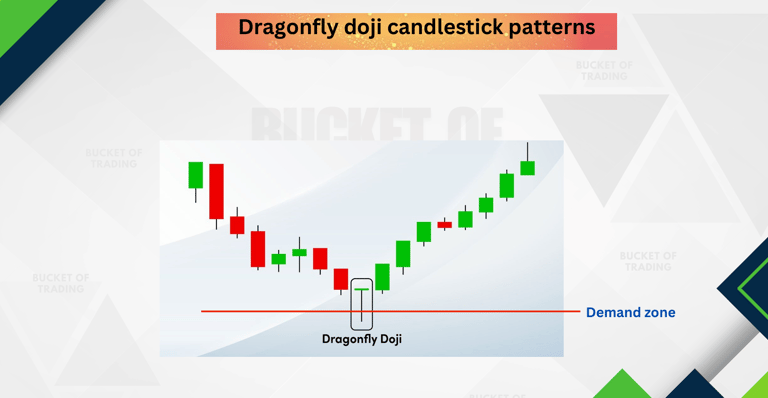
You can use Dragonfly doij candlestick patterns with these type of demand .
wave theory based demand,closing based demand trendline based demand ,fibonacci retracement based demand.
What does Green Dragonfly Doji Candlestick mean?
A green close implies an uptrend. A green Doji pattern forms when the closing price of a stock is higher than the opening price. In this instance, the bulls were able to control the market slightly. This shows that the bulls are still somewhat confident in continuing their positions.
Dragonfly Doji
When does Dragonfly Doji Candlestick occur?
A Dragonfly Doji occurs when the buyers in the market have successfully pushed the session’s candle from the session’s low, back to the session’s open price.
The Dragonfly Doji is a candlestick pattern that occurs when the high, open, and close prices are equal, or nearly similar, while a long wick has created a session low. A wick is a line used to show where the stock’s price has fluctuated to its opening and closing prices.
This long lower wick indicates that sellers sold actively during the timeframe of the candle. Price was able to bounce back and close near the high since the candle closed near the open.
The action can be more significant depending on the length of the wick. The longer the wick, the more effective the action.
Empowerment
Your trusted source for trading education and growth.
Courses
Success
+91-9274215220
2025. All rights reserved.