
Inverted Hammer Candlestick How to use in trading ?
What Is a Inverted Hammer Candlestick?
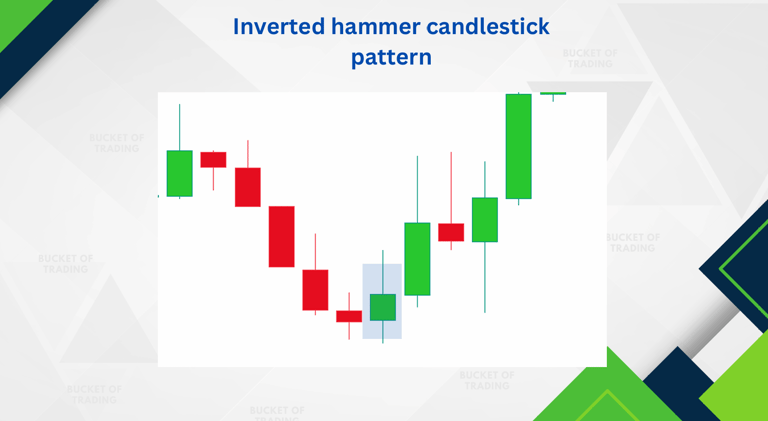
The Inverted Hammer Candlestick Pattern is a chart pattern used in technical analysis to find trend reversals. The Inverted Hammer Candlestick Pattern is formed on the chart when there is pressure from the bulls (buyers) to push the price of the asset higher. This pattern is typically observed at the end of the downtrend, and hence it signals a bullish reversal.
The Inverted Hammer Candlestick Pattern gets its name from its upside-down, hammer-like shape. The Inverted Hammer Pattern is identified with the help of its three main components: a long upper wick, a short lower wick, and a small body. The colour of the body is not significant, but it is generally white or green.


Inverted Hammer
Important point you should note .
Hammer candlesticks typically occur after a price decline. They have a small real body and a long lower shadow.
The hammer candlestick occurs when sellers enter the market during a price decline. By the time of market close, buyers absorb selling pressure and push the market price near the opening price.
The close can be above or below the opening price, although the close should be near the open for the real body of the candlestick to remain small.
The lower shadow should be at least two times the height of the real body.
Hammer candlesticks indicate a potential price reversal to the upside. The price must start moving up following the hammer; this is called confirmations.
minimum 1 minute candle closing confirmation above the inverted hammer required.
You can use inverted hammer candlestick patterns with these type of demand.
wave theory based demand,closing based demand , trendline based demand ,fibonacci retracement based demand.
Inverted Hammer
How is an Inverted Hammer Candlestick Pattern structured?
The Inverted Hammer Candlestick Pattern is structured as a short body at the top of the price range and a long lower shadow, also referred to as the “tail.” There are four key elements to the Inverted Hammer Candlestick Pattern structure.
Body: The body represents the relative difference between the opening and closing prices of the trading period. The colour of the body, whether green , is as important as its position and length.
Upper Shadow (Wick): The size of the upper shadow plays a crucial role in the formation of the Inverted Hammer Candlestick pattern. The upper shadow is a vertical line that extends above the body. The size of the wick in most scenarios is twice the size of the body. The long wick indicates that the price of the asset has rallied significantly from the lows and suggests a strong rejection of lower prices.
Lower Shadow: An inverted hammer’s lower shadow is either nonexistent or extremely brief. It means that there hasn’t been much, if any, price decline during the trading time. The upper shadow’s importance in the pattern is emphasised by the lack of a lower shadow.
Demand and supply Levels: The Inverted Hammer pattern is frequently examined in relation to price chart demand and supply levels. The pattern’s possible bullish connotations are strengthened by the fact that it formed close to a critical demand level. It shows that buyers are active and trying to raise the price from a crucial support level.

Inverted Hammer
The volume analysis also plays an integral role in confirming the structure of the Inverted Hammer Pattern. Traders usually watch for a rise in trading activity as the pattern develops. Rising volume hints at increased purchasing activity and supports the Inverted Hammer’s potential bullish reversal.
Empowerment
Your trusted source for trading education and growth.
Courses
Success
+91-9274215220
2025. All rights reserved.