
Shooting Star candlestick: What It Means in Stock Trading .
What is a Shooting Star Candlestick?
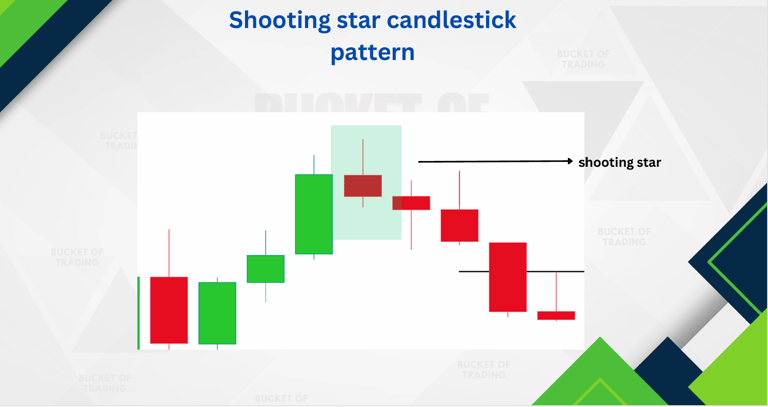
A shooting star candlestick is a price pattern that is formed when the price of security opens and first advances and then declines and falls to a price close to the opening price. Shooting star candlestick patterns signal the start of a price reversal where the trend begins to turn bearish. Shooting star candlesticks comprise a small body, a long upper tail and a short lower tail. The lower tail is at times absent in some shooting stars. The image below depicts a shooting star candlestick pattern.


shooting star
Important point you shoud note
A shooting star occurs after an advance, indicating the price might start falling.2
The formation is bearish because the price tried to rise significantly during the day, but the sellers took over and pushed the price back toward the open.
Traders typically wait to see what the next candle (period) does following a shooting star. If the price declines during the following period they may sell or short the stock.
If the price rises after a shooting star, the formation may have been a false signal or the candle is marking a resistance area around the price range of the candle.
volume bar or the shooting star candle always should be bigger then previous candle bar.
You can use shooting star candlestick patterns with these type of supply.
wave theory based supply,closing based supply, trendline based supply ,fibonacci retracement based supply.
What does Red Shooting Star indicate?
A red shooting star indicates that the closing price of the security is below its opening price. The red shooting star candlestick is considered a more powerful indicator of an oncoming bearish trend as the closing price is at the very end of the candlestick.
A shooting star candlestick pattern occurs when the price of a security increases significantly after opening and then drops rapidly towards the market close to a price level that is close to the opening price. Shooting star candlestick patterns mark the end of an uptrend and signal an upcoming bearish trend.
How accurate is the Shooting Star Candlestick Pattern in Technical Analysis?
The shooting star candlestick is considered one of the most reliable candlestick patterns. The accuracy of shooting star candlestick patterns varies depending on the candlestick patterns that follow the shooting star candlestick. The trend is confirmed to be a bearish trend only if the candlestick pattern that follows a shooting star depicts a price decline. Sometimes the candlestick pattern that follows a shooting star pattern shows a price increase. In such cases, the shooting star is considered a false signal. A price increase that immediately follows a shooting star could also imply the formation of a resistance area around the candlestick. A resistance area refers to a point on the price chart that a security experiences difficulty in breaking and moving above in a specified time frame.
Empowerment
Your trusted source for trading education and growth.
Courses
Success
+91-9274215220
2025. All rights reserved.