
Marubuzo candlestick : How to use in trading ?
What Is a Marubozo?
A Marubozo is a type of candlestick charting formation that indicates a security's price did not trade beyond the range of the opening and closing price. It is a candlestick pattern that lacks a shadow. in that case you can say that almost 80% body candle can identify as a marubozu candlestick.
Gaining days, or up days, strongly indicate that there is a greater demand for the stock than there is a supply. Or at least a greater demand for the stock than there is a willingness to sell it. The opposite can be said on losing, or down days.
Candlestick charting has been popular since the days of Japanese rice merchants and rice traders. They referred to the wide part of the candlestick as the real body, and they would use it to determine whether the closing price had risen above or fallen below the opening price.
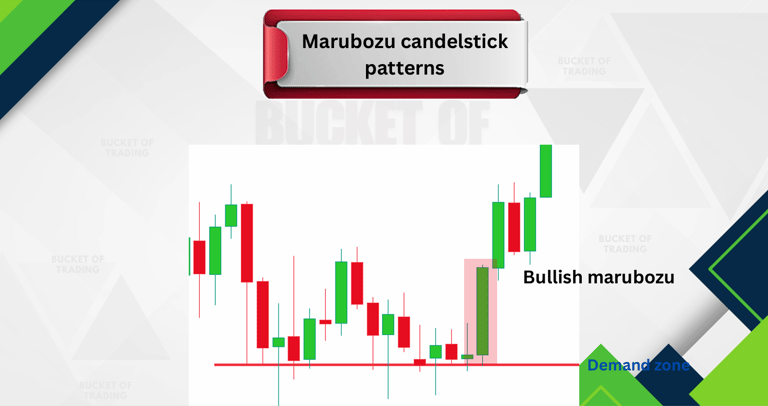
Bullish marubozu
Bearish marubozu
Important point you should note :
A Marubozo is a long-bodied candlestick with no shadow, from the Japanese word meaning "close-cropped".
Candlestick charts look at the opening and closing price on a single day and are used by technical traders.
A candlestick with no shadows is regarded as a strong signal of conviction by either buyers or sellers, depending on whether the direction of the candle is up or down
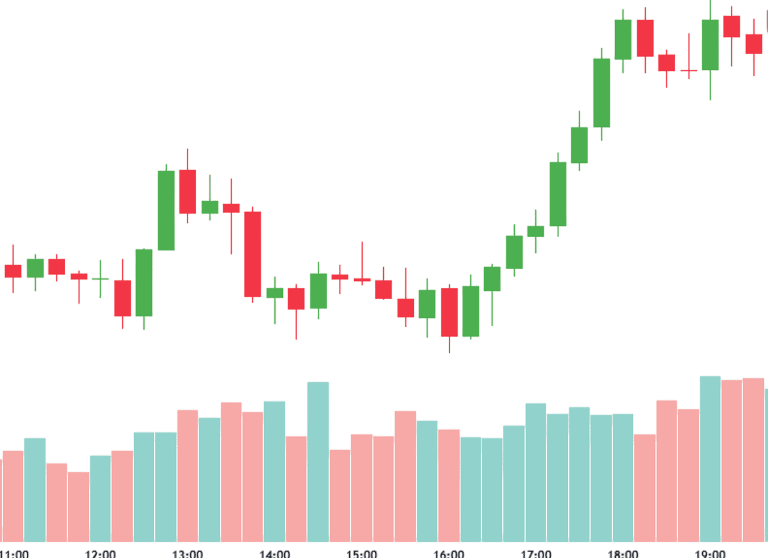
The volume bar of the marubozu candle sould be the biggest candle then previous candle volume bar.
You can use bullish Marubozu candlestick patterns with these type of demand.
wave theory based demand,closing based demand , trendline based demand ,fibonacci retracement based demand.
How is a Marubozu Candlestick Pattern created?
A marubozu candle is created in a price chart when the opening price of a stock is equal to the current low or the closing price is equal to the current high. A red marubozu candle is created when opening price and current low are equal. It is called a bearish marubozu.
A bullish marubozu is created when closing price is equal to the current high. Such a marubozu is green in colour.
A bullish Marubozu candlestick has no upper shadow and a long real body, indicating that buyers were in control for the entire session (or day). A bearish Marubozu candlestick has no lower shadow and a long real body, indicating that sellers dominated the trading session.
Bullish marubozu
How often does the Marubozu Candlestick Pattern occur?
The occurrence of the Marubozu candlestick pattern depends on the time frame and the market conditions. The Marubozu pattern occurs frequently during a bullish period, indicating a strong trend. The Marubozu pattern is less common in a sideways or choppy market, as the price is not trending strongly in one direction.
1. Bearish Marubozu
A candle with an open equal to its high and a close equal to its low is known as a bearish marubozu. This demonstrates the complete dominance of sellers in the market. The stock is under such intense selling pressure that market participants are prepared to sell it at any time during the trading session. The stock’s price ended up close to its session low.
The trend will likely continue strongly when the bearish candlestick shows up during a downtrend, It functions as a trend reversal pattern if it does so during an uptrend indicating that the market sentiment has shifted and the stock is now bearish. It is anticipated that a surge in bearishness will follow this abrupt shift in sentiment and will last for the next few trading sessions. A trader should look for opportunities to sell after the occurrence of a bearish marubozu. The suggested selling price is just a little bit less than the marubozu’s closing price.
Is there a way to improve the accuracy of a Marubozu Candlestick Pattern?
Yes, traders can use four techniques to increase the accuracy of the Marubozu candlestick pattern.
Investors confirm the pattern with other technical indicators, such as moving averages, RSI, or MACD, to validate the trend and gain further insights. They look for volume confirmation, where high volume confirms the strength of the pattern and low volume suggests otherwise. They should consider the context in which the pattern occurs, as it provides a better understanding of the trend. Analyzing multiple timeframes provides a more comprehensive market picture and increases the likelihood that the pattern is a reliable signal.
Empowerment
Your trusted source for trading education and growth.
Courses
Success
+91-9274215220
2025. All rights reserved.