
History of Candlestick Patterns
The history of candlestick patterns dates back to 18th-century Japan, where they were developed by a rice trader named Munehisa Homma. Homma, considered one of the earliest pioneers of technical analysis, discovered that market prices were heavily influenced by emotions, supply and demand, and trader psychology.
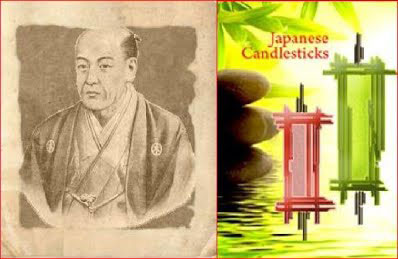
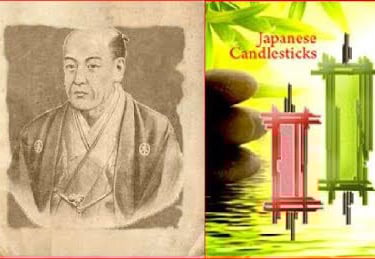
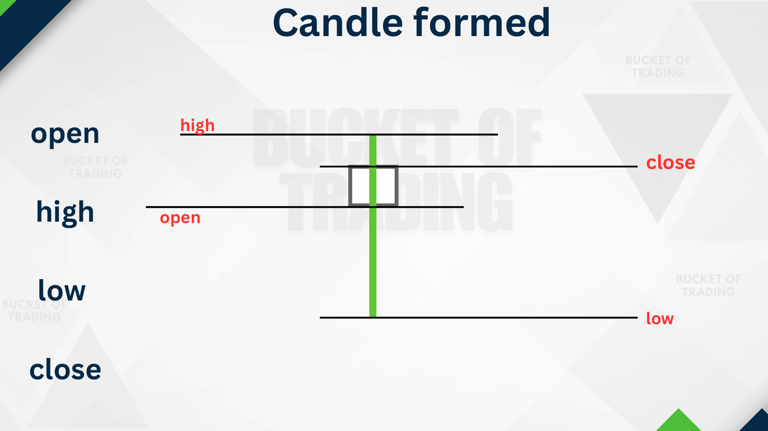
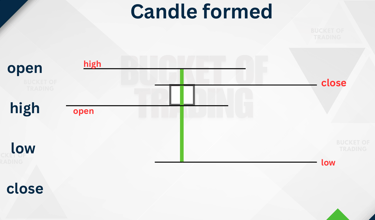
He meticulously recorded price movements and realized that patterns formed by open, high, low, and closing prices could help predict future price movements. These observations led to the creation of candlestick charts, a method that visually represents price action and market sentiment.
Candlestick analysis remained largely a Japanese technique until the late 20th century, when it was introduced to the Western world by Steve Nison. His book, Japanese Candlestick Charting Techniques (1991), popularized these patterns among modern traders and analysts. Today, candlestick patterns are an essential part of technical analysis, used by traders worldwide to identify trends, reversals, and potential market opportunities.

Why is the history of candlestick patterns important? History is not a favourite past time for traders and most traders do not care what happened in the past and they only focus on where the market is going now, but the lessons of the past repeat themselves time and time again.
Empowerment
Your trusted source for trading education and growth.
Courses
Success
+91-9274215220
2025. All rights reserved.