
Hanging Man Candlestick : How to use in trading.
The hanging man candlestick pattern is used when the market is bullish to identify signs of the market turning bearish.The hanging man is a bearish candlestick pattern that indicates a trend reversal. Each individual candlestick is constructed from four data points. The open, close, high, and low are them. These informational pieces help the knowledgeable trader understand the current state of the market.
What is hanging men candlestick ?


The hanging man pattern is formed when the price opens higher than the previous day’s close but then drops significantly during the day, closing near or below the opening price. The pattern looks like a hanging man, hence the name
important point you should note :
A hangingmen is a bearishh reverasl candlestick pattern that occurs after a price advance. The advance can be small or large, but should be composed of at least a few price bars moving higher overall.
The candle must have a small real body and a long lower shadow that is at least twice the size as the real body. There is little or no upper shadow.
The close of the hanging man can be above or below open, it just needs to be near the open so the real body is small.
The long lower shadow of the hanging man shows that sellers were able to take control for part of the trading period.
The hanging man pattern is just a warning. The price must move lower on the next candle in order for the hanging man to be a valid reversal pattern. This is called confirmation.
Minimum 1 min candle closing confirmation below the hanging men candle.
Traders typically exit long trades or enter shhort trades during or after the confirmation candle, not before.
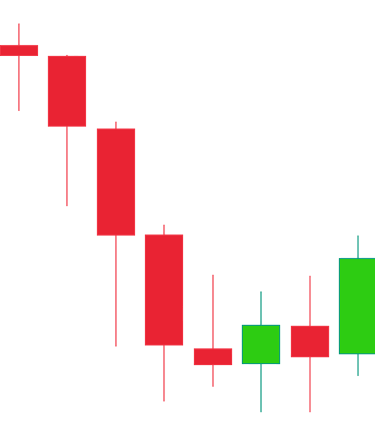
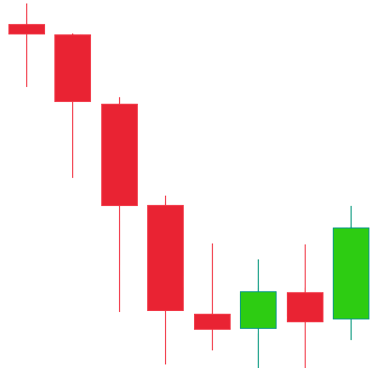

1 min candle closing confirmation below hanging men
What does a Hanging Man Candlestick indicate?
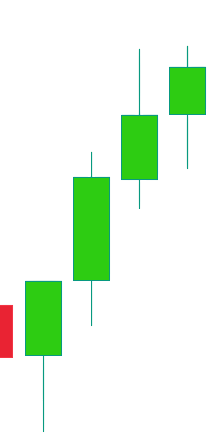
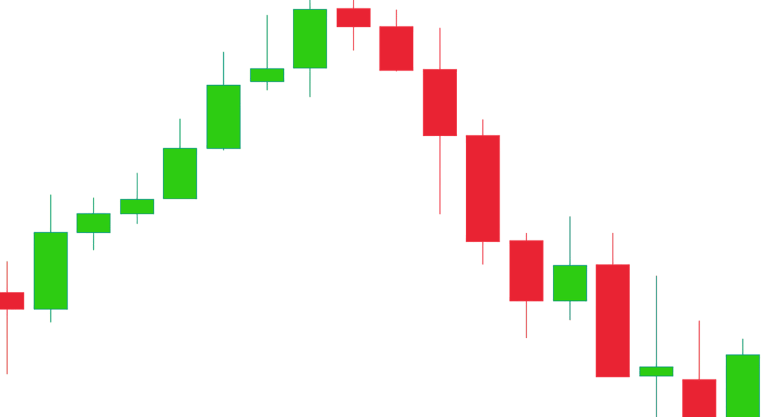
A Hanging Man candlestick is a technical analysis bearish reversal pattern that indicates a potential trend reversal from an uptrend to a downtrend. It forms at the top of an uptrend and has a small real body, a long lower shadow, and little to no upper shadow. The long lower shadow indicates that the price dropped significantly during the day but recovered and closed near the opening price, forming a small real body resembling a hanging man. Below is a picture of the the pattern formation.
You can use hanging men candlestick patterns with these type of supply.
wave theory based supply,closing based supply, trendline based supply ,fibonacci retracement based supply.
How is a Hanging Man Candlestick Pattern structured?
The Hanging Man candlestick pattern has a small real body, a long lower shadow, and little to no upper shadow. The small real body is usually near the candle’s top and can be bullish or bearish. The low of the day is represented by the long lower shadow, which is at least twice the length of the real body, indicating that prices fell significantly during the day. Buyers
The Hanging Men has a long lower shadow, a small real body
Hanging Men
Hanging Men
Hanging Men
Empowerment
Your trusted source for trading education and growth.
Courses
Success
+91-9274215220
2025. All rights reserved.